Table of Contents
Synchronous activities are taken by learners at the same time. Instructors are equipped with control buttons that would trigger the start of an activity (or “pause”, “resume” and “force end”.). This is true with all activity types (iRAT, tRAT, Application Case and Peer Evaluation).
This guide is for:
- Super Admin
- Admin Teacher
- Teacher
Let’s start at the beginning
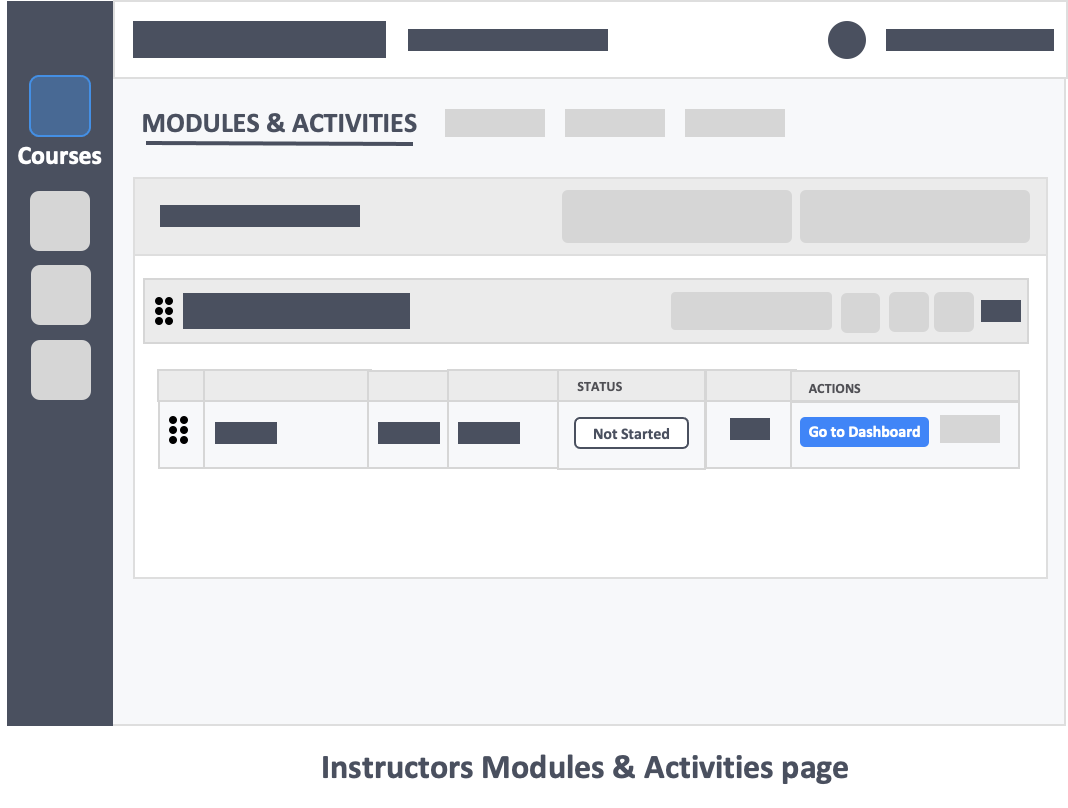
Instructors can either publish the activity ahead of class or during the actual class. Remember that “Published” activities appear on the the learner’s Activities Listing page. Learners can see the activity’s name, but not actually start answering it yet.
🅰 If you’ve published the activity beforehand, you’ll see the “Status” as “Not Started” with an “Action” button “Go to Dashboard“. Click the blue button “Go to Dashboard” to start the activity.
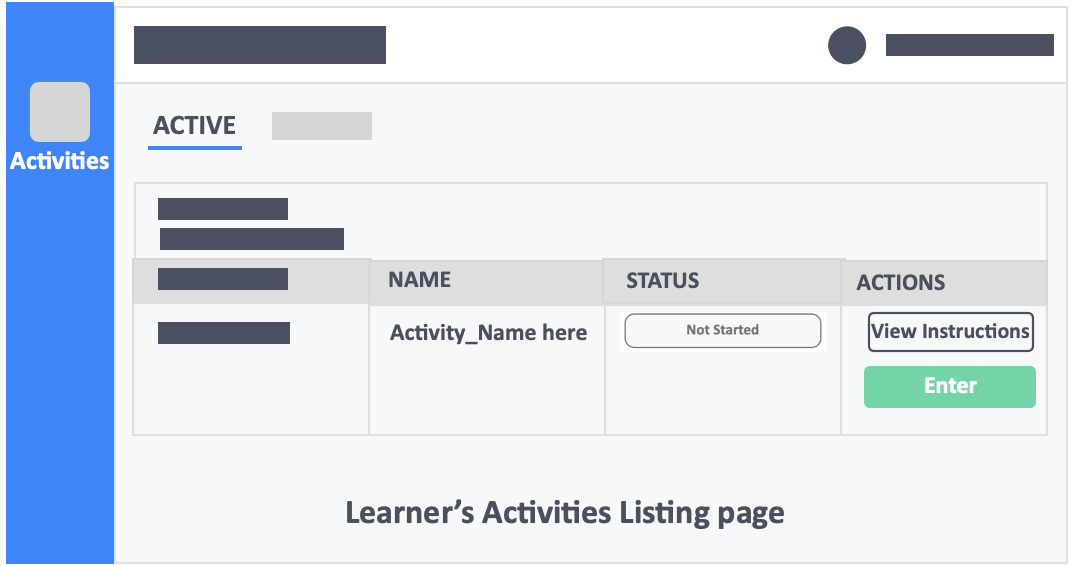
There will be two “Action” buttons for a “Not Started” activity for learners:
❶ “View Instructions” – opens the instructions page.
❷ “Enter” – takes them to a holding screen.
🅱 If you haven’t published the activity yet, you’ll see the “Status” as “Draft” with an “Action” button “Continue Setup“. Click the blue button “Continue Setup“. This will take you to the last page you’ve modified while creating the activity. Click the green buttons on the top-left corner of the pages until you reach the “Publish Your Activity” page.
Once the activity is published, it will then show up on the learner’s Activities Listing page.
Get acquainted with the instructor’s dashboard
Control Panel
❶ At the top-most panel is the timer. It’ll say “Not Started” if the activity is still not started.

Once you click the “Start” button, the timer ( ① )starts here on the dashboard as well as on the learner’s activity–which means learners can start answering questions.

② Click the white arrow icon to open the timer in a new page if you want to share-screen or project the timer for your learners.
③ Click the white button labelled “Extend timer” to add or deduct time to the activity.
❷ Below it are the activity settings–from left to right: (You cannot click these settings.)
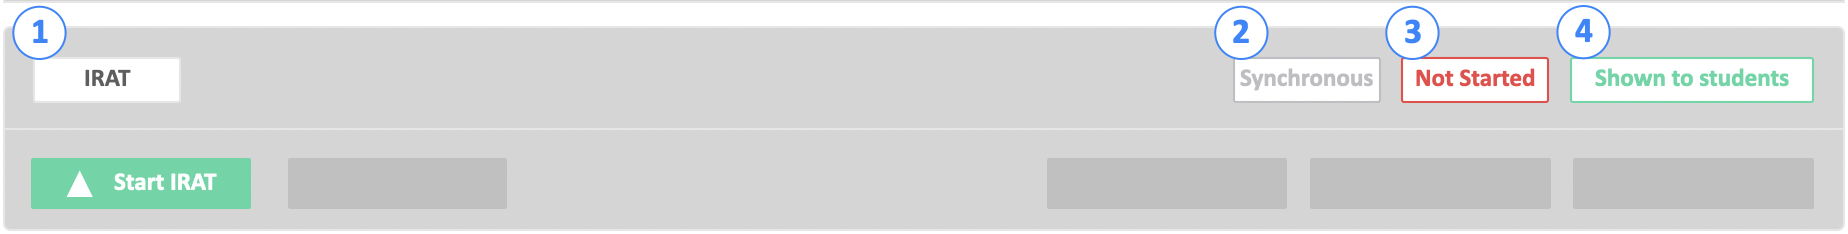
① Type of activity. : “IRAT“
② Modality. : “Synchronous“
③ Status. : “Not Started“. This changes automatically depending on the status of the activity–Not Started, Ongoing, or Ended.
④ Visibility to Learners. : “Shown to Students“. This changes to “Hidden to students” if you toggle the setting to hide the activity.
❸ Below the activity settings are the control buttons.
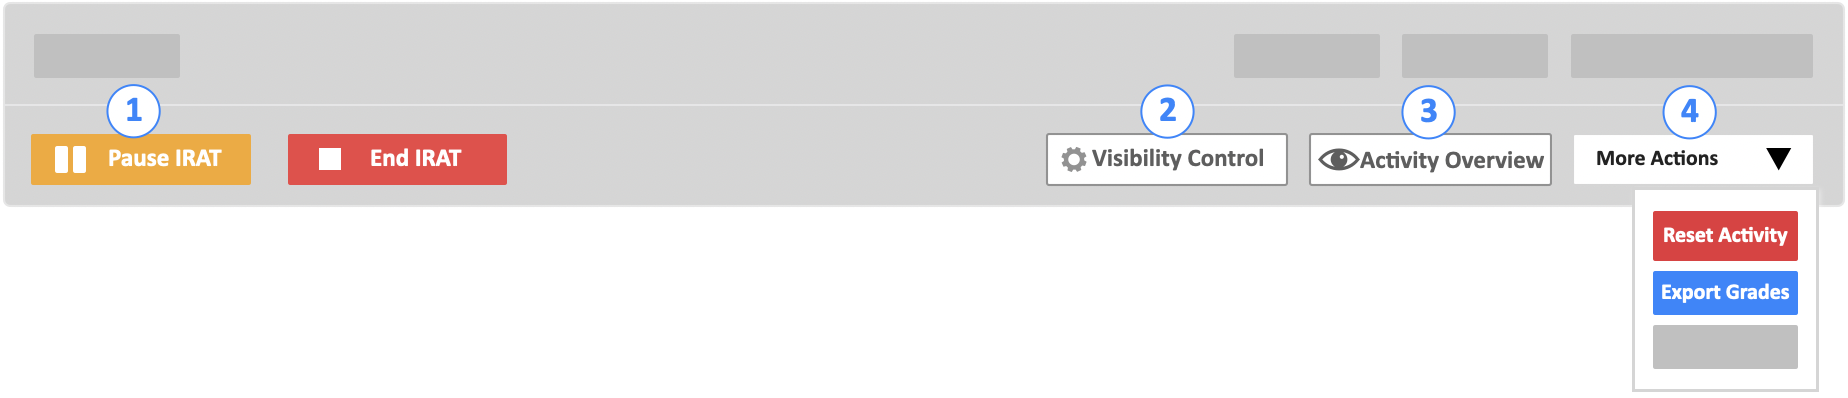
① Activity Controls. : “Start IRAT” , “Pause IRAT“, “End IRAT“
② Visibility Control. : Click the white button labelled “Visibility Control” to change what students can or cannot see by turning on/off toggles.
These toggles will allow you to:
(1) hide the activity from the learners,
(2) allow learners to see their questions and answers (only at the end of the activity),
(3) release the scores to learners (only at the end of the activity).
③ Activity Overview. : Click the white button labelled “Activity Overview” to view the activity’s descriptions, instructions and start/end dates.
④ More Actions: Click the “More Actions” dropdown to trigger a reset on the activity, or an activity grades export.
Activity Settings
Below on the left side of the control panel is the “Activity Settings” panel. These are the learner interaction settings you have set while creating the activity.
The settings here will differ depending on the type of activity–IRAT, TRAT, Application Case, Peer Evaluation–you are running.
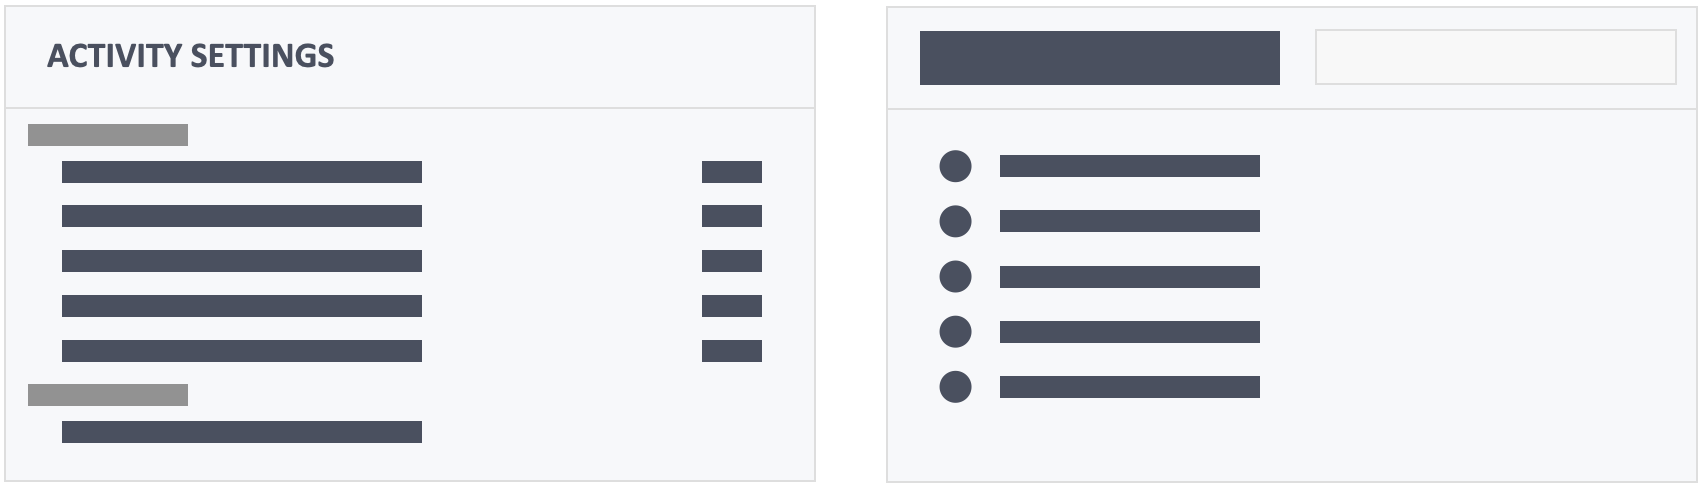
⚠️ If the “Activity Settings” isn’t what you have planned, you can still reset the activity only if you haven’t started it yet.
⚠️ Note that the Activity Password is also here.
Attendance
The attendance panel will show you the following information:
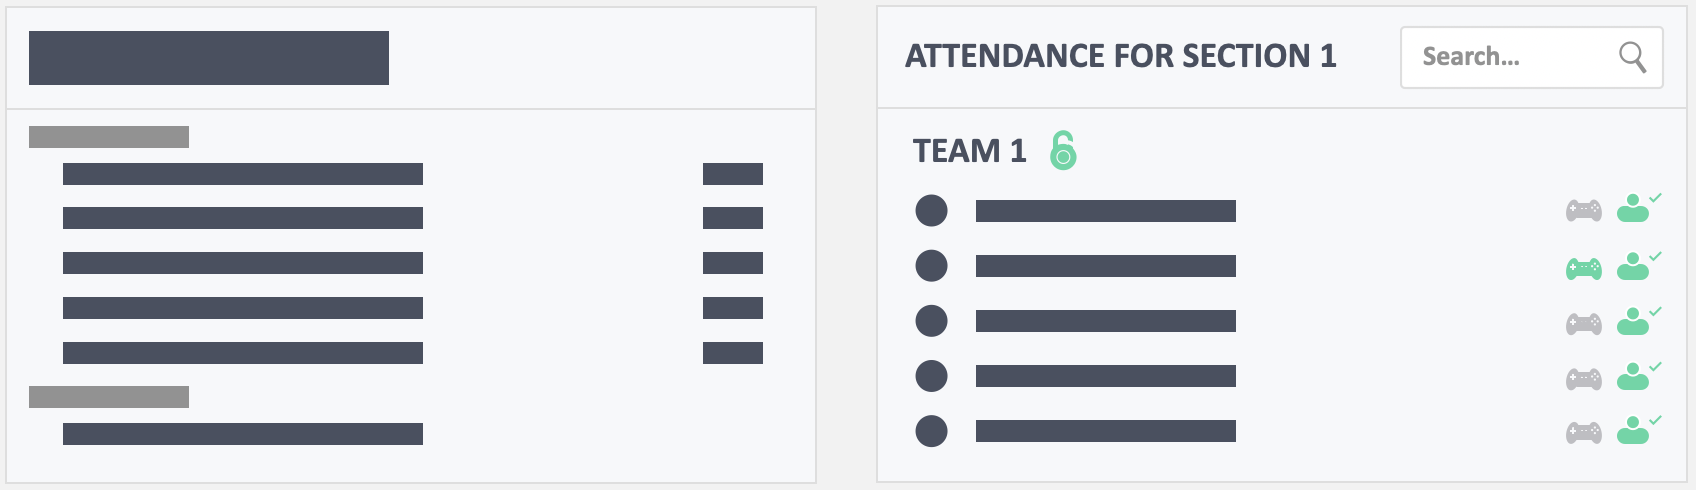
🅰 There are a few things you can do within the Attendance Panel.
- All the learners enrolled to the class,
- In cases when you’re unsure whether the learner is enrolled or not, you can search for the name of the learner in the search bar.
- Learners who have “Entered the test“,(green avatar icon)
- ⚠️ Here’s a recommendation:
- Before you click the green button “Start IRAT” in the control panel, you can ask the learners to click the green “Enter Test” button for the activity.
- The avatars in the right side of the panel will turn green. Learners will be taken to a holding screen. This indicates that the learners are able to access the test.
- ⚠️ If the avatar next to a learner’s name is still gray, he’s either really absent or he’s having some access issue. Troubleshoot activity access issues first.
- Once all the avatars are green, you can then click the “Start IRAT” button to make sure that everyone gets the full time-limit for the activity.
- ⚠️ Here’s a recommendation:
- The team reporter (green controller icon).
- Notice the green controller icon 🎮 beside the avatar. The green controller indicates who the “Team Reporter” is.
- Click the green controller icons to set who the team reporter will be in the teams.
- Notice the green lock icon 🔒beside the team names. This icon indicates that the team can assign a team reporter themselves.
- Click the lock icon to disable the ability to change the team reporter. The lock will then turn red indicating that the team cannot change team reporter.
- Note that the team reporter icon will only appear for team based activities.
- Notice the green controller icon 🎮 beside the avatar. The green controller indicates who the “Team Reporter” is.
🅱 The attendance panel will also show alert messages.
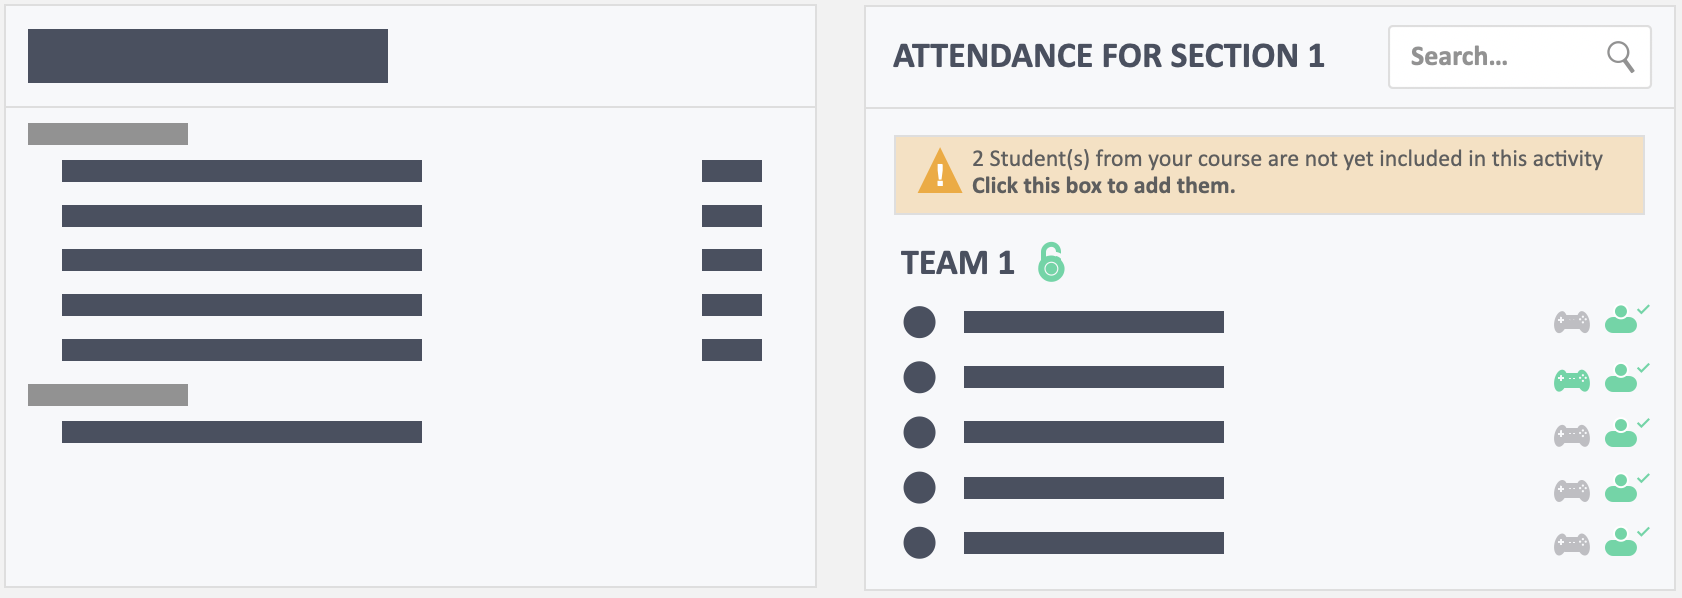
- If there is any learner who is not assigned to a team, an orange alert message will appear in the attendance panel.
⚠️ Note that unassigned students won’t be able to take the activity at all.- To assign the student into a team,
- Click the orange box to open a dialog box,
- Choose the team the learner will be assigned to,
- Tick the box for approval,
- Click the green button labelled “Update” at the bottom of the box.
- To assign the student into a team,
Status
The Status Panel is very helpful for when the test is “Ongoing“. Looking at the bars will let you know if you need to extend the time or end the activity already.
The bars represent the following counters.
❶ Learners who may time out
- At the start of the activity, all learners who are taking the test are potentially going to time-out, i.e. 9/9 students.
- As the activity progresses, (and learnerss saves answers for all the questions) the bar and counter reduces.
- ✅ Our recommendation : If the red bar or the counter is still high, you might want to extend the timer to allow students more time to finish the activity.
❷ Learners who have answered all questions
- The yellow bar 🟨 represents the number learners who have saved an answer for all the questions. i.e. 4/9 studiers have answered all questions.
- ✅ Our recommendation : If the yellow bar or the counter is still low, you might want to extend the timer to allow students more time to finish the activity.
❸ Learners who have submitted
- The green bar represents the number of learners who have clicked the “Submit Test” button, i.e. 2/9 students have submitted the activity.
- The “Submit Test” is equivalent to “learners passing their papers.” When a learner clicks this button, this would mean that they have been alerted that they won’t be able to change any of their answer anymore if they continue.
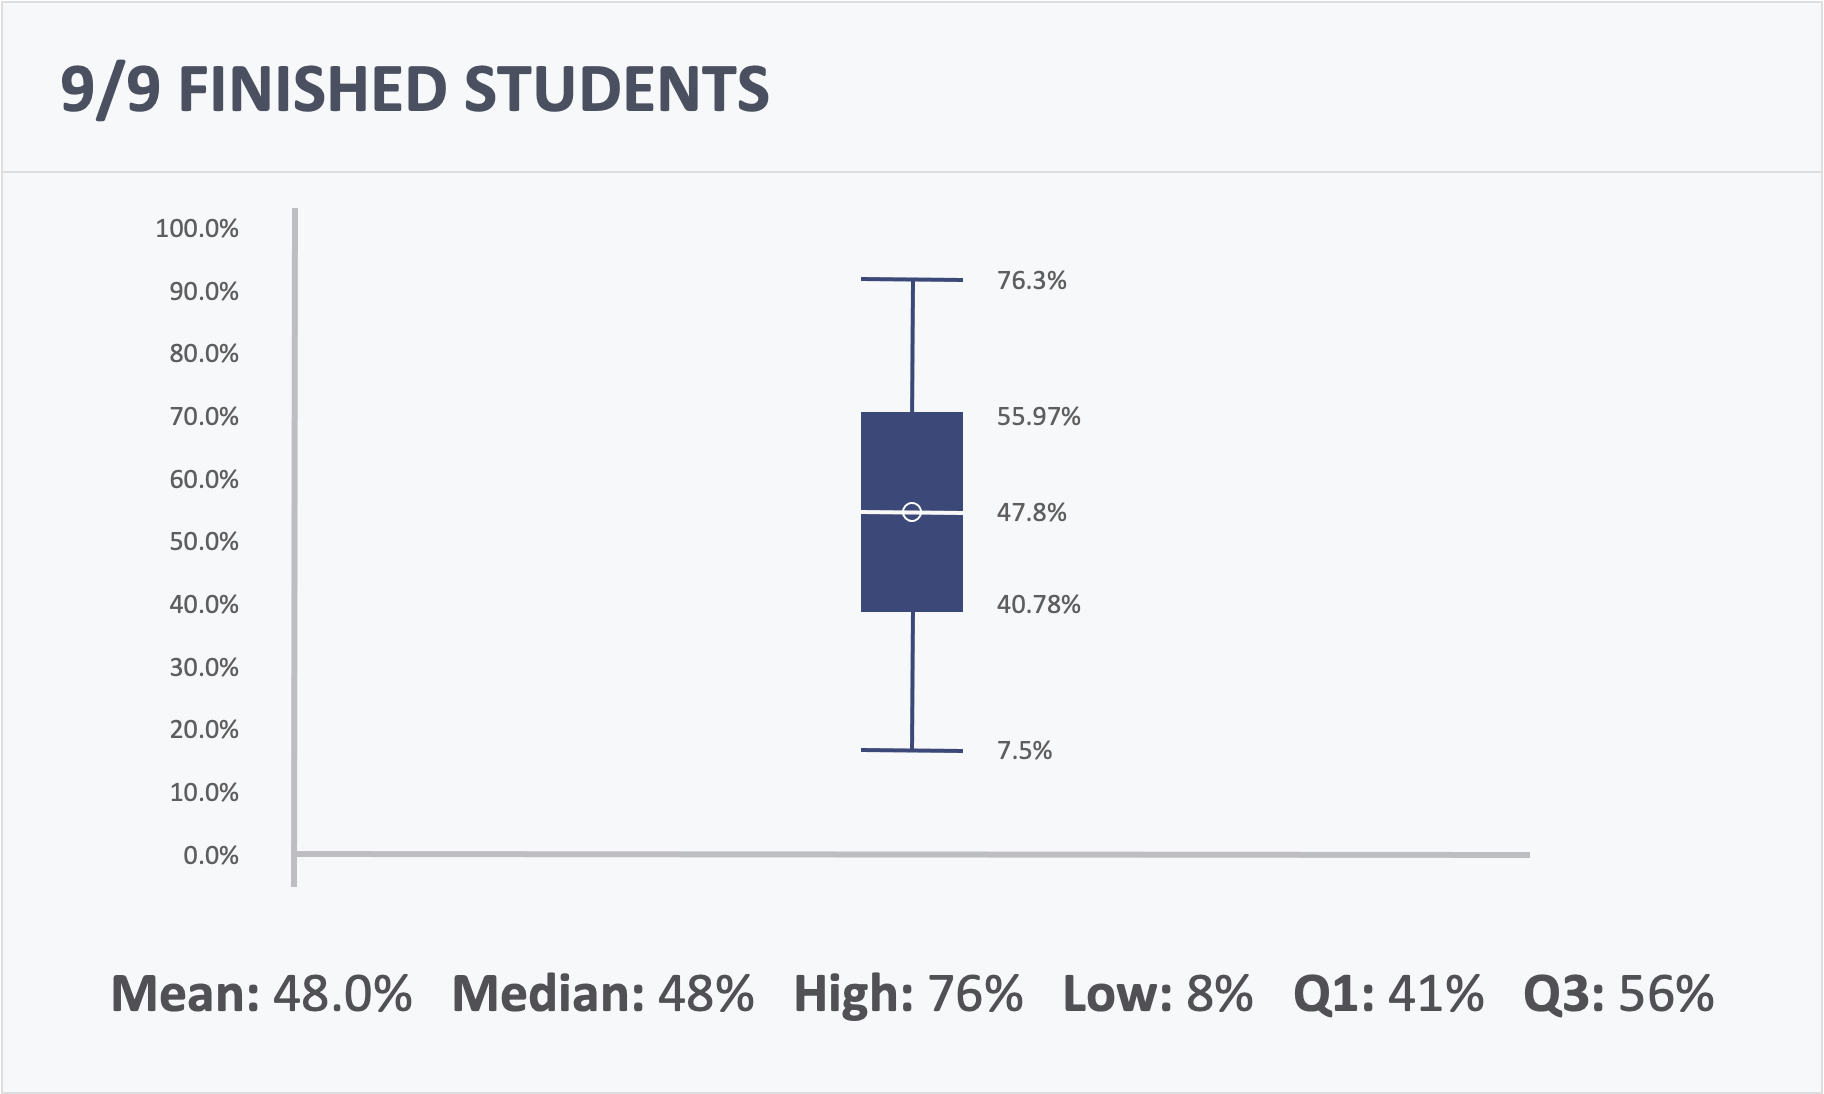
Mean, Median, High Low
This graph shows the mean, median, high and low scores for the entire class.
Item Analysis
The Item Analysis table is equipped with live data that you can use to
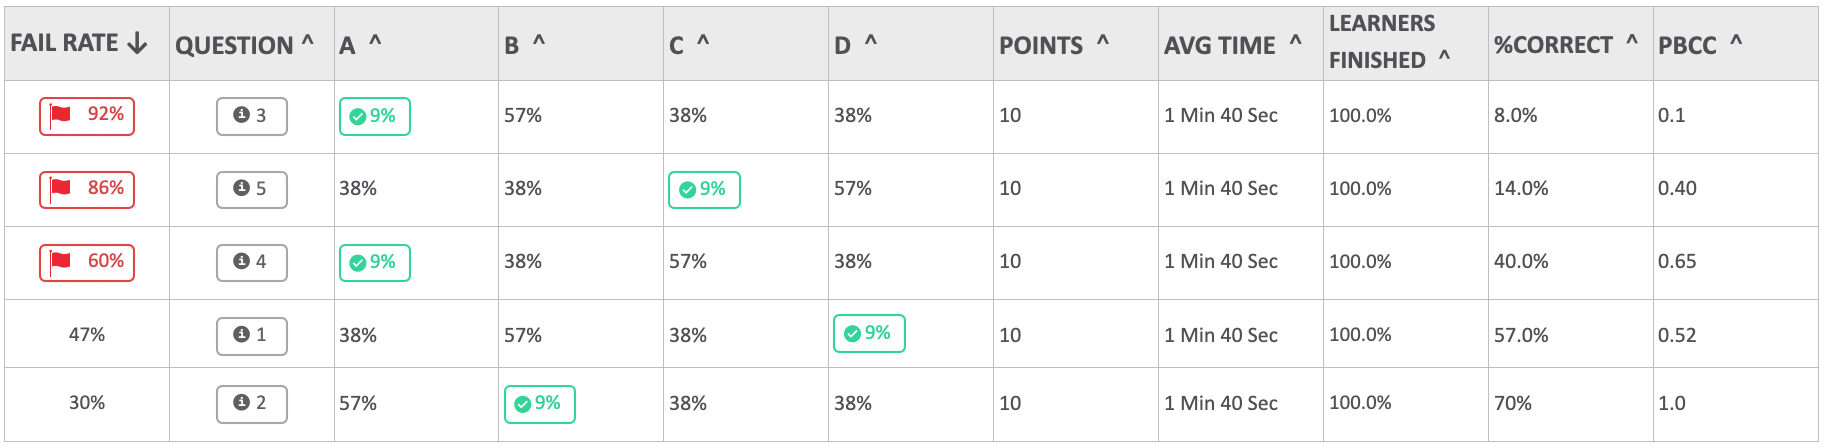
- The table automatically reorganizes the questions based on the highest fail-rate percentage.
- Click the table header to sort each column to ascending to or descending order, depending on what you need.
- ✅ Our recommendation : While the test is ongoing, take a look at the “Fail Rate” and “Question” columns. The higher the fail rate the higher its potential for a need to discuss. Click on the question number button to open the question.
View Item Analysis Dashboards by Activity Type
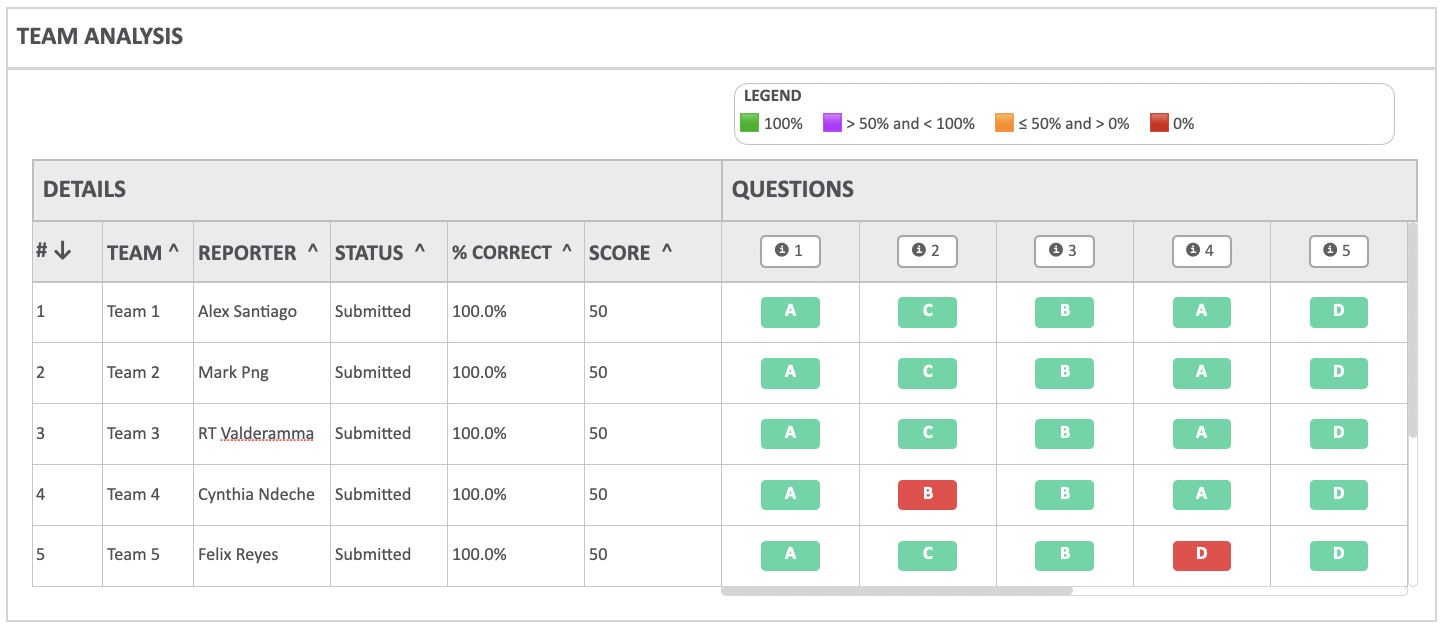
Learner / Team Analysis
🅰 The Learner or Team Analysis table shows a breakdown of answers by learners or by teams. Different activities–IRAT, TRAT, Application Case, Peer Evaluation – Michaelsen’s Method, 360 Degree Evaluation– will look the same but will also contain slightly different data and columns.
🅱 History of Learner answers
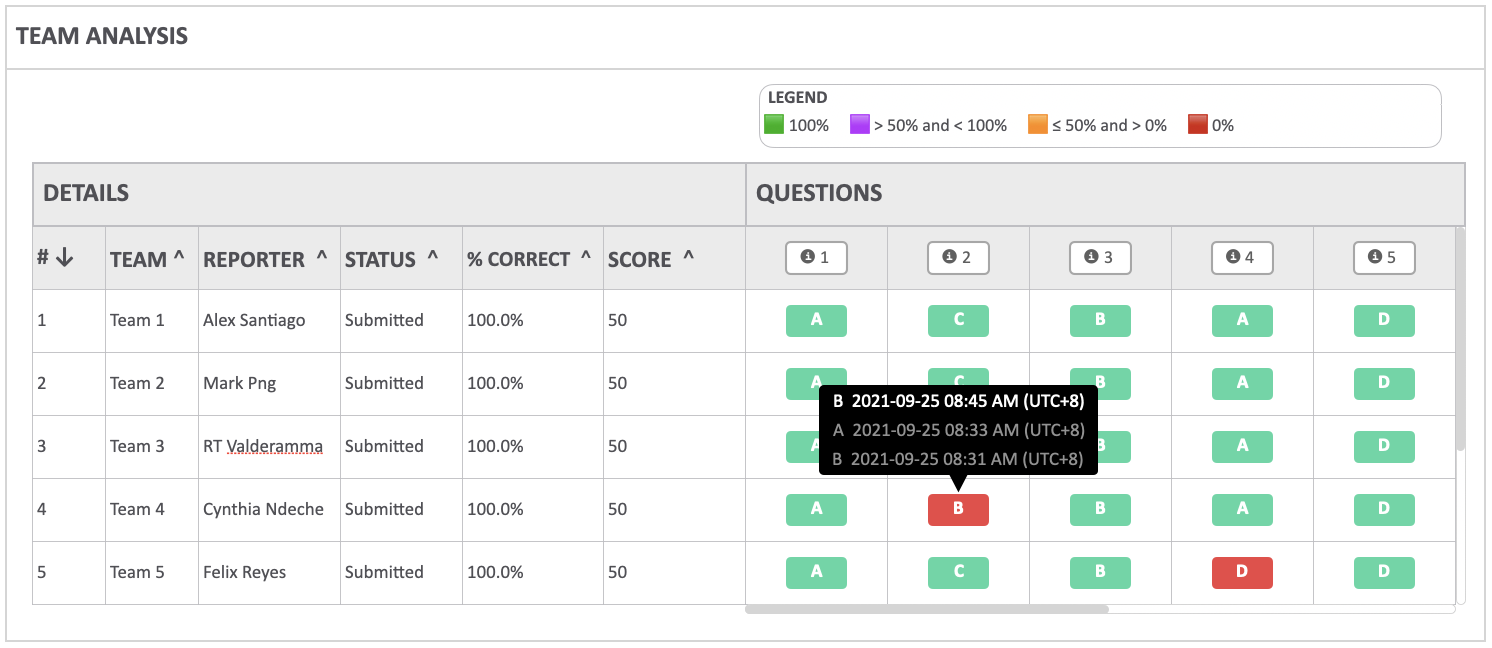
- Hover on learner answers to see the history of changes of answers done by the learner with the timestamps per change.
- This is helpful in mitigating the anxiety for instructors because they can now see a history of answers saved by learners whilst taking the iRAT.
- 👁🗨 The timestamps can also be seen by learners. This would let the learner know which answer is the last saved answer, and assures them that the changes they’ve made are recorded.
View Learner or Team Analysis Dashboards by Activity Type
Questions
At the bottom of the instructor’s dashboard is the “Questions” panel. These are all the questions in this specific activity, shown per page.
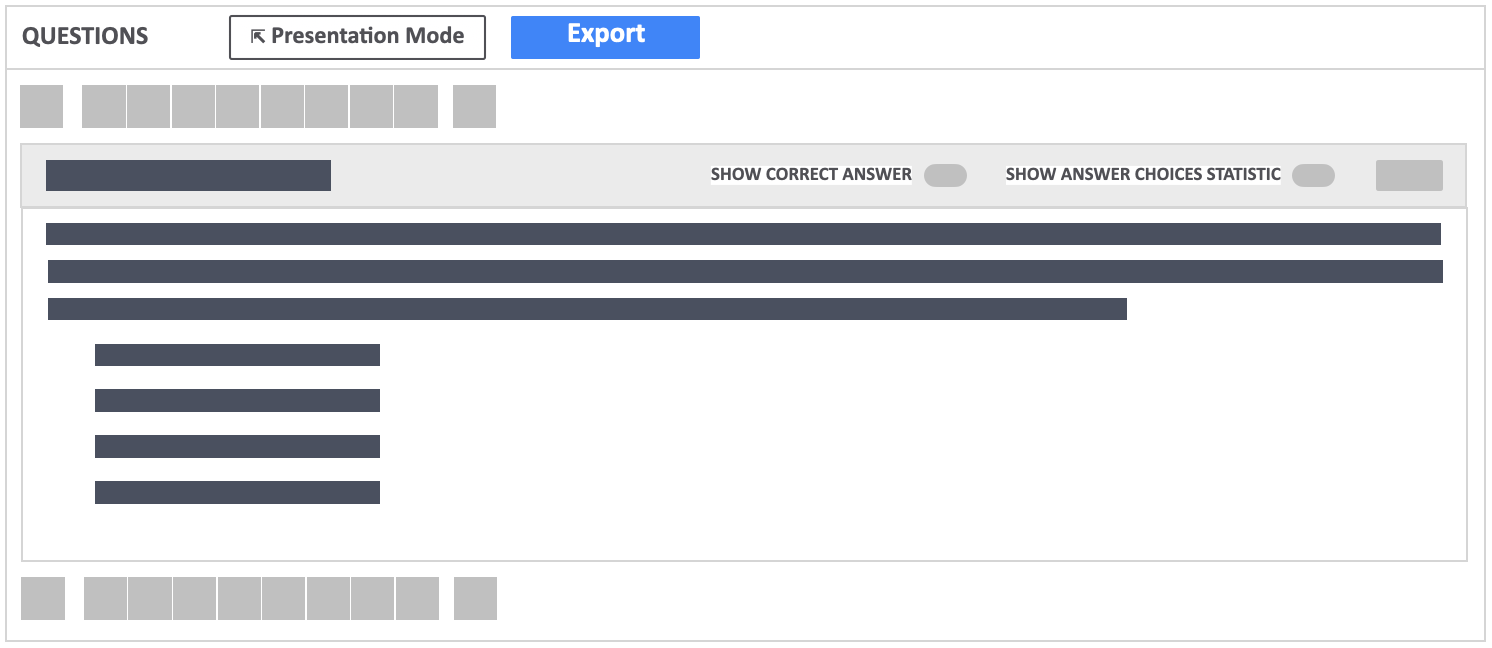
It is equipped with toggles and buttons which you can use to facilitate discussion.
🅰 Presentation Mode
- The Presentation Mode is a screen you can use to project or screen share with learners. Click here to learn more : How do I start a discussion about my activity’s questions?
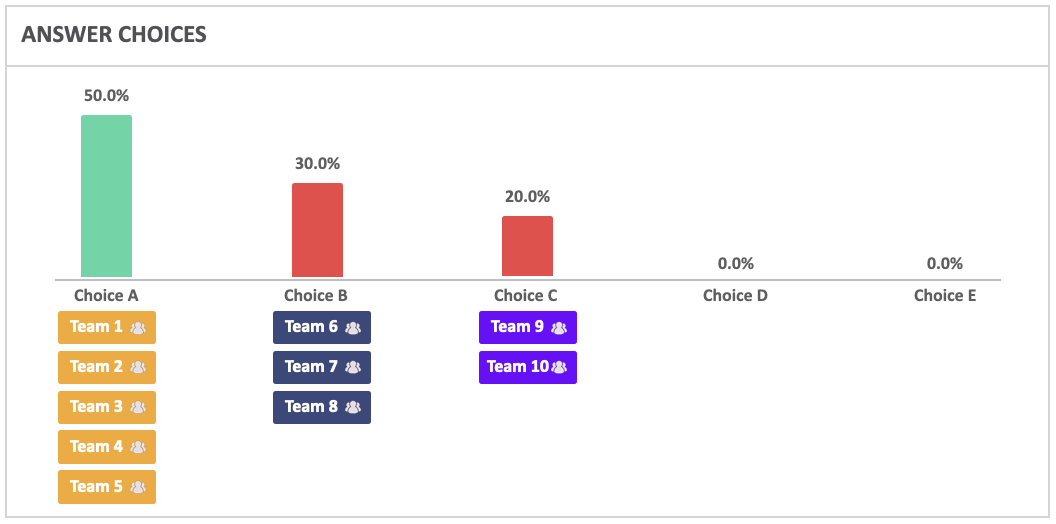
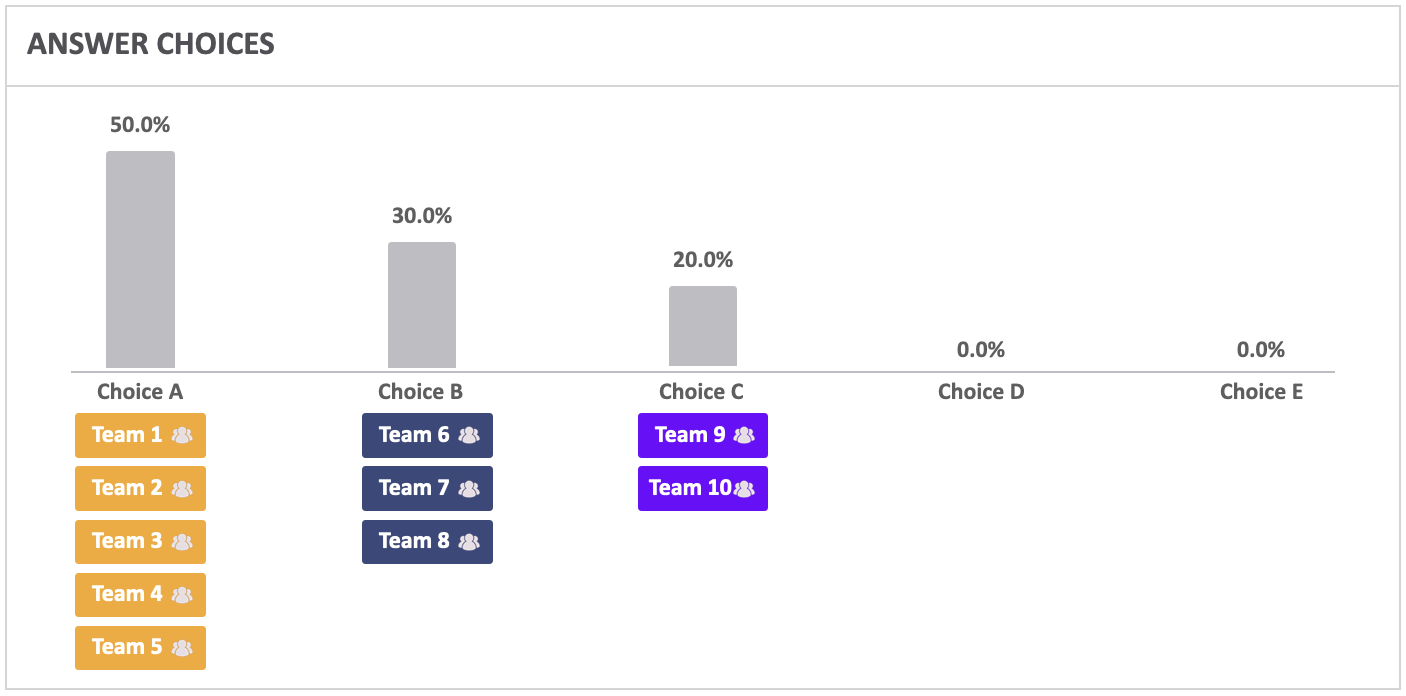
🅱 “Show” toggles
- Show answer choice statistic
Toggle this “yes” to show a graph of learner or team answers breakdown per answer choice.
- Show correct answer toggle
Toggle this “yes” to show which answer (s) is correct and incorrect